Counting cells in blood smears
BCCD is 364 photographs of blood smears with 4,888 boxes in three classes - red cells, white cells, platelets - and its own train/validation/test split. It is small, it is MIT-licensed, and its classes are wildly unbalanced, which turns out to be the most instructive thing about it.
Where the numbers come from. The anchor figures and the box counts below were produced on this machine from the published weights, with nothing trained; the five-seed table is examples/detect_blood_cells.py’s, measured with the engine on its own at four loader workers. Which number came from where matters here more than usual, and the section on scoring says why.
Before any of that: boxes in a few lines
A detector trained on this data is published, so the shortest way to see whether this works is to borrow it. No training, no GPU, no waiting.
A detection dataset arrives in Pascal VOC’s layout - one flat directory of images beside one flat directory of XML - which is neither of the two layouts the package reads. Turning it into one is the only data wrangling here:
import pyplatypus as pp

# `annotations`, not `masks`: a detection specification looks for that column, because what
# labels an image here is an annotation file and not a picture. Absolute paths, because a
# path in a CSV is resolved against the CSV's own directory.
Path("bccd-test.csv").write_text(
    "images,annotations\n"
    + "\n".join(
        f"{(root / 'JPEGImages' / f'{name}.jpg').resolve()},"
        f"{(root / 'Annotations' / f'{name}.xml').resolve()}"
        for name in names
    )
)
BCCD’s own split - 205 train, 87 validation, 72 test - and not one invented here, which is the only reason the numbers below can be compared with anybody else’s on this dataset.
published = pp.from_dict(
    {
        "task": "object_detection",
        "data": {
            "train_path": "bccd-test.csv",
            "validation_path": "bccd-test.csv",
            "classes": ["RBC", "WBC", "Platelets"],
            "mode": "config_file",
        },
        "models": [
            {
                "name": "cells",
                "architecture": "yolo3",
                "input_shape": [416, 416],
                "weights": "bccd-yolo3",
                "fit": False,
            }
        ],
    }
)
engine = pp.build_engine(published)
engine.fit()
found = engine.predict("cells", "validation")
fit() loads rather than trains when fit: false is set; predict before it answers no model has been trained or loaded yet.
Predictions come back as one table per image in the photograph’s own pixels - xmin, ymin, xmax, ymax, score, label, name - so the boxes land on the picture without anything being undone first.
And here, unlike the nuclei article, a score means something
Those weights were trained on BCCD’s 205 training images. Its 72 test images the model has never seen, so measuring on them is honest - which is the opposite of the nuclei article, where the convenient directory overlapped the training data and no number was reported at all.
The model card’s own figures are mAP@0.5 of 0.857, mAP@[.50:.95] of 0.500 and a mean matched IoU of 0.806, and available_weights() carries them. The description is the part to read before trusting them: published is the median of five seeds rather than the best, and platelets are the unreliable class - which the scoring section shows rather than asserts.
One refusal worth meeting now
A detector’s weights decode boxes relative to the anchors they were trained with. Read with any others, the same numbers produce boxes scaled by a fixed factor: plausible boxes, plausible scores, wrong places, and nothing in any output to say so. So a specification that names both is two claims about one model with one of them untrue:
ConfigError: The configuration has 1 problem:
  - models[0]: model 'cells' names both `weights` and `anchors`. A detector's weights decode
    boxes relative to the anchors they were trained with, so loading uses the ones recorded
    beside the file - which would leave the anchors in this specification describing nothing.
    Remove `anchors` to use theirs, or remove `weights` to fit new ones to your own boxes.
Refused by the file, before any path was read - and that is a different stage from the nuclei article’s refusal, which waits for the weights because only then is there a shape to compare. Two claims in one file need nothing but the file; a claim about a file on disk needs the file.
Anchors, which a detector has and a U-Net does not
YOLOv3 does not predict a box from nothing. It predicts a correction to one of nine anchors - fixed shapes, three per grid - and which anchors you use decides how much correcting is left to learn. Unset, they are fitted to your own boxes with k-means; the published weights carry theirs in the sidecar beside the file.
Measured here on the published anchors against BCCD’s training boxes: mean IoU 0.8769. COCO’s own nine, borrowed, manage 0.65 on the same boxes - which is the difference between a correction and a rewrite, and it costs nothing to avoid.
A mean hides which class it is made of. A coverage of 0.65 is either every class covered adequately or two covered well and the third not at all, and those want different fixes. The picture tells them apart:
figure = pp.plot_anchors(engine, log=True, model="cells", split="train")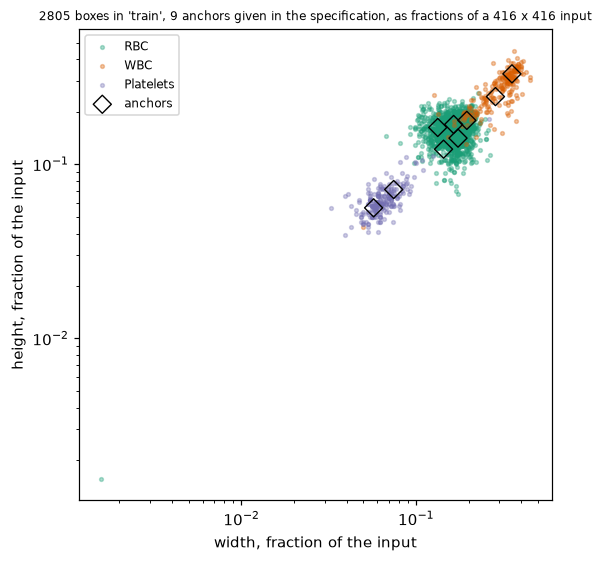
Each point is one annotated box - its width against its height, both as fractions of the 416x416 input - and the diamonds are the anchors. Log axes, because the anchors alone run from about 24 to 147 pixels a side, and on linear ones the smallest class collapses into the corner.
Three clouds, because the three cell types are three sizes, and a diamond near each. The diamonds are not spread evenly: most sit in the crowded middle where the red cells are, which is k-means doing exactly what it was asked - put the anchors where the boxes are, not where the classes are.
And one point sits far below everything else, at about two thirds of a pixel a side. That is not a drawing error and not an outlier in the statistical sense - it is a bad row. Counted here, straight out of the XML:
| split | boxes | of zero extent |
|---|---|---|
| train | 2,805 | 1 |
| validation | 1,138 | 1 |
| test | 945 | 0 |
A zero-width box read under Pascal VOC’s inclusive convention comes out one pixel across. k-means drops it, because an overlap with a box that has no area is undefined - which is why the anchors were fitted to 2,804 boxes while the plot draws 2,805. The plot keeps it deliberately: a dataset’s bad rows are worth seeing once, and this is the only place in the whole run where that one is visible at all.
It is also the clearest way to see why COCO’s nine manage only 0.65 here. Those span 10 to 373 pixels a side, because COCO holds objects of every size; these three cell types span about six-fold. Most of that range is spent on boxes this dataset does not contain.
Worth drawing for the split they were not fitted on. Anchors covering the training boxes well and the validation boxes badly would say the two halves hold different objects, and no training curve shows that:
figure = pp.plot_anchors(engine, log=True, model="cells", split="validation")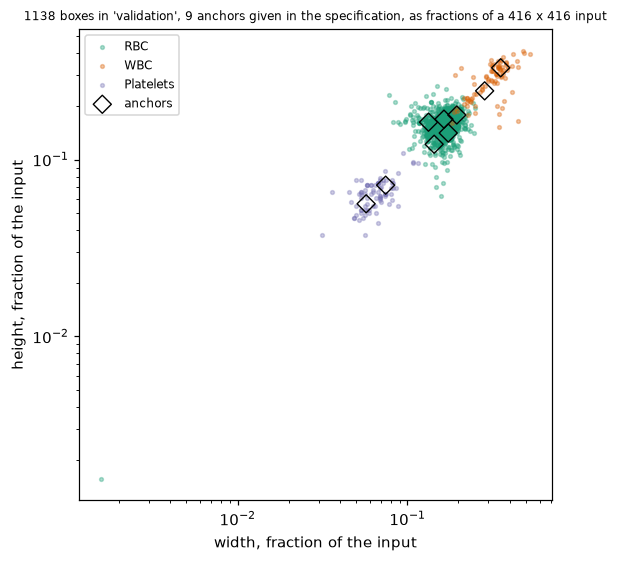
tools/readme_figures.py article-bccd draws both, from the published weights and without training. The issue that asked for them priced them at a 37-minute run, which is the cost of fitting anchors rather than of drawing the ones a published file already carries.
What the loss is doing
The run reports four parts rather than one, and the total is the least useful of them.
The total does not reach zero and that is not a stall. Cross-entropy against a soft target bottoms out at the target’s own entropy, so the coordinate term has a floor above zero that depends on the data. Which is exactly why the parts are separate: a total of 5.95 means nothing alone, while coordinates 5.94 beside objectness 6.7e-04 says the model has learned what is where and is still refining the boxes.
Scoring, and the number that is missing on purpose
engine.evaluate("test") returns mAP@0.5, mAP@[.50:.95] and mean_matched_iou, with the truth and prediction counts beside them. There is no overall precision and no overall recall, and the absence is deliberate: averaging them over classes needs a weighting, and every choice of weighting is a different claim. Over BCCD’s 4,155 red cells, 372 white and 361 platelets, a single precision is a statement about red cells wearing the costume of a statement about the model.
engine.evaluate_classes("test") is the form in which they mean something. White cells are nearly perfect - one per image and large. Platelets come back at a precision near 0.56, meaning about 44% of the platelets reported are not there, and their boxes fit worst of the three at an overlap near 0.73.
mAP@0.5, mAP@[.50:.95], and which to believe
Two averages answering different questions. The first asks whether an object was found; the second averages over ten overlap thresholds and so also asks how well the box fits. The gap between them is localisation, and mean_matched_iou says that in one number instead of through a difference.
On this dataset the overlap is far steadier than the average precision. Five runs of one recipe differing only in the seed:
| mean | sd | |
|---|---|---|
| mAP@0.5 | 0.8660 | 0.0159 |
| mAP@[.50:.95] | 0.5159 | 0.0199 |
| mean IoU of matched boxes | 0.8041 | 0.0026 |
Six times steadier. Which rank the model gives a borderline platelet moves average precision and leaves the overlap alone - so on a dataset this size, a point of mAP is not a result, and mean_matched_iou is the number to read first. That is not a general law about detection; it is what these 364 images do, and it was found by running five seeds rather than one.
And a seed does not pin the number. It pins which random numbers are drawn, not the order they are consumed in, and the loader’s worker count changes that order. So the same seed means the same recipe on one machine with one worker count. The R vignette this page mirrors records the cost of learning that: a paragraph there quoted a single run’s mAP, and the next knit of the same document disagreed with it by more than a point.
Looking at it
The comparison is the point. Truth in one colour, predictions in another, on the same image, with plot_boxes(images, predictions, truth=truth, min_score=0.5).
One detail in reading the truth matters more than it looks. Pascal VOC is 1-based and inclusive of both ends, so a box written xmin=1 xmax=10 is 0 to 10 as a continuous interval. Reading it as 0-based shifts every box by a pixel and shrinks it by one - invisible by eye, and real IoU on a platelet 41 pixels across.
A detector that found the right number of objects in the wrong places and one that found the wrong number in the right places score similarly and look nothing alike, which is why this picture is worth more than either average.
What this does not do
It is not a cell count. A precision near 0.56 on platelets means a count taken from these boxes is too high by about 79%. Counting needs either a better model for the small class or a threshold chosen for counting rather than for a figure, and either way it needs measuring against truth on your own data.
It is one small collection. 205 training images at one magnification, stained one way. BCCD is a demonstration dataset.
It is not a diagnostic tool, and a result from it is not a laboratory result.
Notes on the machine
YOLOv3 is 61.5 million parameters, thirty times a U-Net at the settings in the nuclei article, so this is the one place in the package where the hardware matters: 150 epochs is about 37 minutes on a GTX 1070.
A card of that generation needs the CUDA 12 build of PyTorch. This package does not install torch and will not choose a build for you - you install your own, so the equivalent of the R package’s platypus_use_torch("pascal") is asking your index for the CUDA 12 wheels. If torch.cuda.is_available() is False on a machine that has a GPU, check that first: a run that quietly went to the processor looks exactly like a run that is simply slow.