Finding nuclei in microscopy images
The 2018 Data Science Bowl asked for the nuclei in microscopy images: several hundred pictures, taken down different microscopes under different stains, each with its nuclei outlined. It is a good first problem because it is genuinely varied and genuinely small.
This walks through it end to end.
Where the numbers come from. The figure and the foreground shares below were produced on this machine by the code shown; the trained rows are examples/data_science_bowl.yaml‘s, and the published weights’ scores are the registry’s own. Nothing was trained to write this page.
Before any of that: a mask in four lines
A model trained on this data is published, so the shortest way to see whether the package does anything useful is to borrow it. No training, no waiting:
import pyplatypus as pp

published = pp.from_dict(
    {
        "task": "semantic_segmentation",
        "data": {
            "train_path": "examples/data/data_science_bowl/stage1_validation",
            "validation_path": "examples/data/data_science_bowl/stage1_validation",
            "mode": "nested_dirs",
            "colormap": [[0, 0, 0], [255, 255, 255]],
        },
        "models": [
            {
                "name": "nuclei",
                "input_shape": [256, 256],
                "weights": "dsbowl-unet",
                "fit": False,
            }
        ],
    }
)
engine = pp.build_engine(published)
engine.fit()
masks = engine.predict("nuclei", "validation")
masks.shape
fit() is still the call and fit: false only changes what it does - with the flag set it loads rather than trains. build_engine reads the data and builds the model; a predict straight after it answers no model has been trained or loaded yet.
Notice what the specification does not say: no architecture, no blocks, no filters. A published file records its own geometry and the engine adopts it, so naming them would risk a specification that disagrees with the file - and the file would win.
figure = pp.plot_masks(images, prediction=masks[:3])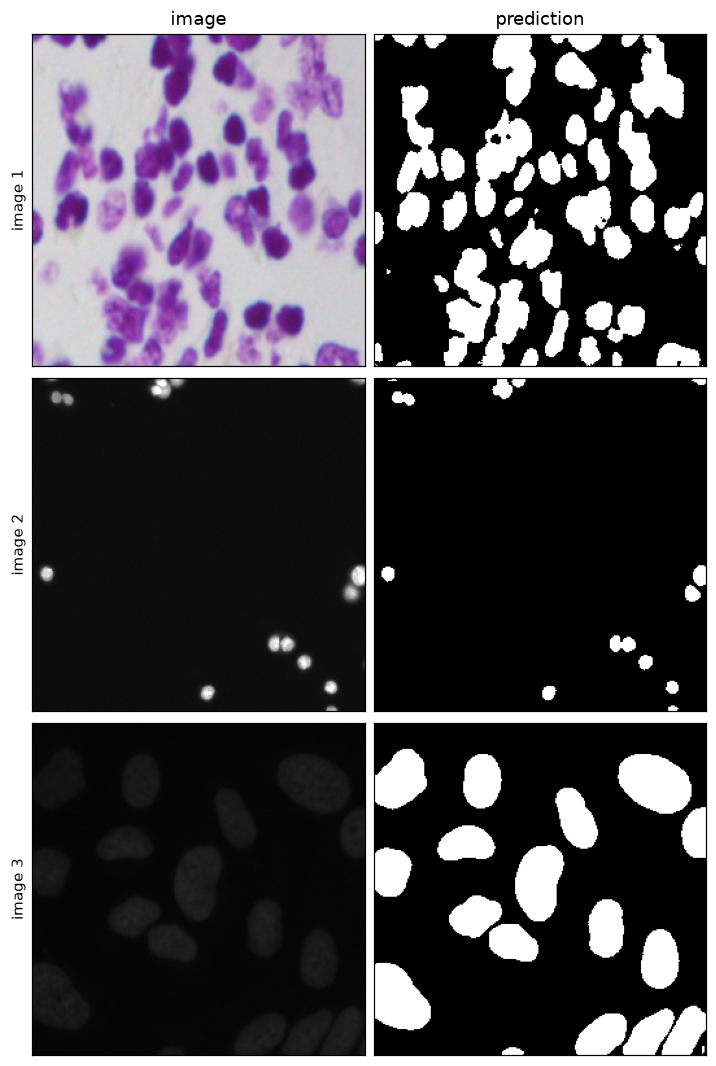
The weights came down from the Hub on first use and are cached afterwards, so running this again costs nothing. tools/readme_figures.py article-dsbowl is the script that drew it.
No score is reported here, on purpose. This directory and the one the weights were trained on come from the same collection and overlap, so anything measured here would flatter the model. The numbers that mean something were measured on a held-out split when the weights were published, and travel with them - available_weights() carries the description, and it says these are semantic, so touching nuclei come back as one region and a count taken from them would be wrong. Telling touching nuclei apart is the article about that.
One thing worth meeting here rather than later. Weights belong to an exact model, not to a task, and the rest of this page trains at 160x160 while these were trained at 256:
mismatched = pp.from_dict(
    {
        "task": "semantic_segmentation",
        "data": {
            "train_path": "examples/data/data_science_bowl/stage1_validation",
            "validation_path": "examples/data/data_science_bowl/stage1_validation",
            "mode": "nested_dirs",
            "colormap": [[0, 0, 0], [255, 255, 255]],
        },
        "models": [
            {
                "name": "nuclei",
                "architecture": "u_net",
                "input_shape": [160, 160],
                "blocks": 4,
                "filters": 16,
                "weights": "dsbowl-unet",
                "fit": False,
            }
        ],
    }
)
pp.build_engine(mismatched).fit()
WeightsError: 'dsbowl-unet' was trained for a different model:
- input_shape: weights say (256, 256), the model says (160, 160)
Loading anyway would either fail inside torch or, where the shapes happen to agree, produce
a model that predicts confidently and means nothing.The file itself is fine and that is the point of the two stages. from_dict accepts this: every field is spelled correctly and 160 is a legal input_shape. The refusal comes when the weights are loaded, because only then is there something to compare them against - which is why the message names the field rather than a tensor size.
Refused with the field that differs, and before torch was reached. That check exists because the failure it prevents is silent: weights trained on a different colormap with the same number of classes load perfectly and predict nonsense.
Everything below trains a model from scratch instead, which is what you will actually do on your own data - the published weights are a demonstration and a baseline, not an answer to your problem.
The data
One directory per image, each holding an images and a masks subdirectory. The masks subdirectory holds one file per nucleus:
stage1_train/
  00ae65c1c.../
    images/00ae65c1c....png
    masks/8a0ac8e3c....png      # one file per nucleus, 27 of them in this case
    masks/9a1e2f4b7....png
    ...
536 cases in stage1_train and 134 in stage1_validation, and mode: nested_dirs is what reads that shape. For a semantic task the per-nucleus files are united - their element-wise maximum - which is the step that turns which nucleus into nucleus or not. That is the right thing here and the wrong thing for counting, which is the other article’s subject.
Look at it before training on it
The most useful thing to know before choosing anything else is how much of each picture is actually the thing you are looking for.
import numpy as np
from pathlib import Path

def foreground(case: Path, size=(160, 160)) -> float:
    united = np.zeros(size, dtype=bool)
    for file in (case / "masks").glob("*.png"):
        united |= pp.read_image(file, channels=1, size=size, nearest=True)[..., 0] > 0.5
    return float(united.mean())
Over forty cases drawn from stage1_validation, measured on this machine:
| min | Q1 | median | mean | Q3 | max | |
|---|---|---|---|---|---|---|
| foreground share | 0.013 | 0.033 | 0.109 | 0.133 | 0.214 | 0.455 |
Nuclei are a minority of the pixels in every image, and how small a minority varies by a factor of 35 between images. Both facts are worth acting on now rather than discovering later. The R vignette this page mirrors reports 0.011 to 0.334 over its own forty - a different sample of the same data, and the same conclusion.
Because the foreground is a minority, a model that predicts background everywhere and finds nothing at all still scores well on accuracy, and well on a Dice averaged over both classes. So the metrics in the configuration below are asked for with include_background: false: the number reported is then the one about the nuclei, and a model that finds none of them scores zero, as it should.
Because the share varies so much, the loss has to hold up at both ends. Plain cross-entropy will happily settle into predicting background on the sparse images; blending it with Dice, or using Focal-Tversky with alpha above a half, keeps the rare class worth getting right.
The specification
Two models, so there is something to compare. They share the data and differ in architecture and objective - u_net with cce_dice, and linknet with focal_tversky at alpha: 0.7:
models:
  - name: unet
    architecture: u_net
    input_shape: [160, 160]
    blocks: 4
    filters: 16
    loss:
      name: cce_dice
    metrics:
      - name: dice
        include_background: false
      - name: iou
        include_background: false
    epochs: 6

  - name: linknet
    architecture: linknet
    input_shape: [160, 160]
    blocks: 4
    filters: 16
    loss:
      name: focal_tversky
      alpha: 0.7            # weight missed nuclei more than false alarms
    epochs: 6
The alpha: 0.7 weights false negatives above false positives: it would rather flag something that is not a nucleus than miss one. Whether that is the right trade depends entirely on what the count is for.
Train
spec = pp.from_yaml("examples/data_science_bowl.yaml")
engine = pp.build_engine(spec, num_workers=4)
history = engine.fit(verbose=True)
num_workers=4 is worth copying: the GPU spends most of a run waiting for PNGs to be decoded, and nothing about the model changes.
Compare
engine.evaluate("validation") returns one row per model, and the columns to read are the metrics rather than the loss.
Read the loss column with care, and note that loss_function sits beside it. These two models were trained on different objectives, so their losses are not on a common scale - a Focal-Tversky of 0.31 is not better or worse than a CCE-Dice of 0.22, it is not the same question. The metrics are comparable, because they measure the mask rather than the objective.
That is the column this table exists to make unquotable, and it is the same shape of mistake as dice in the instance table, where a mean over a different number of class channels made two models look 0.09 apart when their masks were 0.006 apart.
Look at what it did
predictions = engine.predict("unet", "validation")
figure = pp.plot_masks(images, prediction=predictions[shown], truth=truth)
The last column is the one that repays attention. Green is what was found, red what was missed, yellow what was invented - and a single overlap score cannot tell you which of the three you have.
On this data almost all of the red is a thin rim around nuclei that were otherwise found. The model is locating nuclei well and drawing them slightly too small. If the question is how many nuclei are there, that hardly matters. If it is how large are they, it is exactly what matters - and the fix is a longer run or a loss that weights boundaries, not a different architecture.
Neither the Dice nor any other single number distinguishes those two situations from a model that found three quarters of the nuclei and missed the rest. That is the reason to draw the picture.
The same thing from a file
Everything above is one file in this repository:
spec = pp.from_yaml("examples/data_science_bowl.yaml")The configuration guide walks the fields; Every configuration field is the reference beside it, generated from the models that read the file.
A note on older graphics cards
PyTorch 2.8 and later ship CUDA 13 builds, and CUDA 13 dropped the Maxwell, Pascal and Volta generations - a GTX 10-series card cannot run them, and no driver update changes that.
This package does not install torch and will not choose a build for you. You install your own, so the equivalent of the R package’s platypus_use_torch("pascal") is asking your index for the CUDA 12 wheels. If torch.cuda.is_available() is False on a machine that has a GPU, that is the first thing to check - otherwise everything above runs on the processor instead, perhaps ten times slower, and says nothing about it.