Retinal vessels: tiling, and a metric Dice cannot replace
FIVES is 800 colour fundus photographs at 2048 x 2048 - 200 each of normal, AMD, diabetic retinopathy and glaucoma - with a vessel tree drawn over every one. It is CC BY 4.0, it ships its own balanced train/test split, and it is the only dataset in this documentation that cannot be handed to a network whole.
Three things here appear in no other article, and each is the reason this dataset was chosen.
It tiles. splits reads each image at full resolution and cuts it into a grid of inputs.
It is scored on a metric Dice cannot stand in for. clDice asks whether a structure is connected rather than whether its pixels coincide, and a skeleton is a property of a whole mask, so it is measured on the reassembled image rather than on the tiles.
It reports per disease rather than as one mean, which is how the interesting thing about this dataset was found - and the interesting thing turns out not to be about the disease.
Where the numbers come from. Everything below is one run of examples/segment_retinal_vessels.py at its own defaults - 40 epochs, 6.7 hours on a GTX 1070 - whose record is measurements/fives/fives.json in the project’s workbench, with the quality join printed by measurements/fives/quality.py and the figure drawn by that same script’s --figures. Unlike the other articles’ figures, this one cannot be redrawn from published weights alone: it is this run’s prediction, and the script draws it at the end of the run rather than from a file. The published fives-unet weights are a second run of exactly this configuration and score 0.8789 where this one scores 0.8828; where a number below belongs to those weights rather than to this run, it says so. The last section is different again and says so in its own first paragraph.
This page mirrors vignette("retinal-vessels") in the R package, which is the source for the prose: the walk is the same, the route is not. R reaches these destinations through constructors; here they are reached through a configuration file.
Why a vessel cannot be resized
FIVES images are 2048 x 2048, and the obvious move is to resize them to something a U-Net is comfortable with. It is the wrong move here, and the reason is a measurement rather than a preference.
A FIVES vessel is about nine pixels wide - measured as mask area over skeleton length, over six random masks. Resized to 256 the same vessels are about 1.2 pixels. That matters because of what happens at one pixel: shift a one-pixel structure by a single pixel and it overlaps the truth nowhere at all, so Dice, IoU and clDice alike read zero and none of them can tell a near miss from a total failure. Tiling keeps the data out of that regime, which is what splits is for.
(The nine-pixel figure corrects the one-to-five this dataset is usually described with. One to five is what remains after a resize - a property of the preprocessing, not of the retina.)
The last section of this page measures what that claim is actually worth, and it is narrower than this paragraph makes it sound.
The data
One 1.7 GB download, CC BY 4.0. The authors’ own split is already balanced across the four groups - 150 train and 50 test of each - so it is used rather than replaced.
The archive is laid out as Original/ and Ground truth/ with matching file names, which is not a layout the package discovers on its own, so the pairs are written into a CSV and the specification reads that:
from pathlib import Path

FOLDER = "FIVES A Fundus Image Dataset for AI-based Vessel Segmentation"

def write_split(root: Path, split: str, out: Path) -> int:
    # `glob("*.png")` rather than everything in the directory: the archive ships a
    # `Thumbs.db` beside the 600 training images, and a Windows thumbnail cache is not a
    # fundus photograph. Filtering by extension is also what keeps the pairing below honest.
    images = sorted((root / FOLDER / split / "Original").glob("*.png"))
    rows = ["key,images,masks"]
    for image in images:
        mask = root / FOLDER / split / "Ground truth" / image.name
        if not mask.exists():
            raise SystemExit(f"{image.name} has no mask beside it")
        # The key is the file's own name. Without it a `config_file` sample is called
        # `row 55`, which names nothing on disk and cannot be grouped by - and grouping is
        # most of what this page has to say.
        rows.append(f"{image.stem},{image.resolve()},{mask.resolve()}")
    out.write_text("\n".join(rows) + "\n")
    return len(images)
The disease is in the file name - _N, _A, _D, _G for normal, AMD, diabetic retinopathy and glaucoma - which is what the grouping below reads.
The configuration
task: semantic_segmentation
data:
  train_path: measurements/fives/splits/train.csv
  validation_path: measurements/fives/splits/test.csv
  colormap: [[0, 0, 0], [255, 255, 255]]
  mode: config_file
models:
  - name: vessels
    architecture: u_net
    input_shape: [512, 512]
    # 2048 read whole and cut 4 x 4. This is the field the page exists for.
    splits: [4, 4]
    blocks: 4
    filters: 16
    batch_size: 4
    epochs: 40
    loss:
      name: cce_dice
    metrics:
      - name: dice
        include_background: false
      - name: iou
        include_background: false
      # Measured on the reassembled image by `evaluate_cases()`, not per tile.
      - name: cldice
        iterations: 12
        include_background: false
    optimizer:
      name: adam
      learning_rate: 0.001
    callbacks:
      - name: early_stopping
        monitor: val_dice
        patience: 8
        restore_best: true
    augmentation:
      - name: HorizontalFlip
        params:
          p: 0.5
      - name: VerticalFlip
        params:
          p: 0.5
seed: 1
Two things about that worth saying out loud.
cldice sits among the metrics even though the run is tiled, and the engine reassembles each case before measuring it. It will not appear in the epoch log, and that is deliberate rather than an omission: an epoch averages its metrics over batches, which is exact for Dice - a ratio of sums - and meaningless for a skeleton, because a tile severs every vessel crossing its edge. So there is no val_cldice to watch, early_stopping watches val_dice, and a callback that asked for the other is refused when the specification is read.
iterations: 12 is the skeleton’s peel count, and it is chosen against the nine pixels measured above: a structure nine pixels across needs about half that many erosions to reach its centreline, and twelve leaves room for the widest vessels in the set rather than the average one.
Training
import pyplatypus as pp

spec = pp.from_yaml("fives.yaml")
engine = pp.build_engine(spec, num_workers=4)
history = engine.fit(verbose=True)["vessels"]
num_workers=4 is worth a line of its own here rather than in a footnote. Training shuffles in windows so that one decoded image serves all sixteen of its tiles; four workers decoding 2048-pixel PNGs ahead of the GPU is the difference between an epoch that waits on the disk and one that does not. This run took 403 minutes over 40 epochs, with its best validation Dice at epoch 34 - it did not stop early, which is worth remembering when the last section compares budgets.
One number hides the finding
for row in engine.evaluate():
    print(row)
That is the whole test set as one row, and it is the least informative view of it. The distribution is the finding, and evaluate_cases() gives it - one row per case, with clDice measured on the reassembled image inside the same walk over the split:
cases = engine.evaluate_cases("vessels")Over the 200 test images: mean Dice 0.8828, mean IoU 0.8014, mean clDice 0.8869, best case 0.9596 and worst 0.1098. Now by the disease in the file name:
| disease | n | dice | sd | worst |
|---|---|---|---|---|
| AMD | 50 | 0.9105 | 0.0474 | 0.7001 |
| diabetic retinopathy | 50 | 0.8792 | 0.0697 | 0.5807 |
| glaucoma | 50 | 0.8393 | 0.1770 | 0.1098 |
| normal | 50 | 0.9020 | 0.0452 | 0.7187 |
Glaucoma is the worst group, by several points, with four times the spread of the best one and a worst case near zero. The reading that offers itself is that the model is worse at glaucoma.
Before concluding that, check whether it is the group whose photographs are worse. FIVES ships a Quality Assessment.xlsx grading every image for illumination and contrast, blur and low contrast. Nothing in this pipeline reads it. Joined to the per-case scores it inverts the finding:
| n | dice | |
|---|---|---|
| graded clean | 133 | 0.9161 |
| graded poor on any flag | 67 | 0.8166 |
and, on the clean images alone, glaucoma is the best of the four groups and the tightest, at 0.9325 with a standard deviation of 0.0232 against normal’s 0.9138. What makes it the worst group overall is that 28 of its 50 test photographs carry a flag, against 8 of AMD’s - and 14 of the 15 low-contrast images in the whole test split are glaucoma.
That is the general lesson rather than a fact about retinas: a per-group table is worth having precisely because it invites the question why is this group different, and the first answer is rarely the right one.
clDice beside Dice
Over the same 200 cases:
| correlation of dice and cldice | 0.9779 |
| mean of clDice minus Dice | +0.0041 |
| sd of that difference | 0.0219 |
Read the first two together, because they say different things. The correlation is high: the two metrics rank the cases much the same way, so clDice is not finding a different set of bad images. The mean difference is small and positive, which says the vessels this model draws are about as connected as their pixel overlap suggests.
That is a property of the model rather than of the metric, and the R vignette’s own run is the evidence. At fifteen epochs instead of forty, clDice sits about five points below Dice there: the model is getting the right pixels and breaking the lines. The better-trained model closes the gap, so a large negative gap is not clDice being pessimistic - it is clDice measuring what fifteen epochs had not finished learning, and Dice not noticing.
The last section finds the same column doing the same work across eleven objectives, which is the strongest version of this point available.
The worst case, drawn
A table says a case scored near zero. A picture says why.
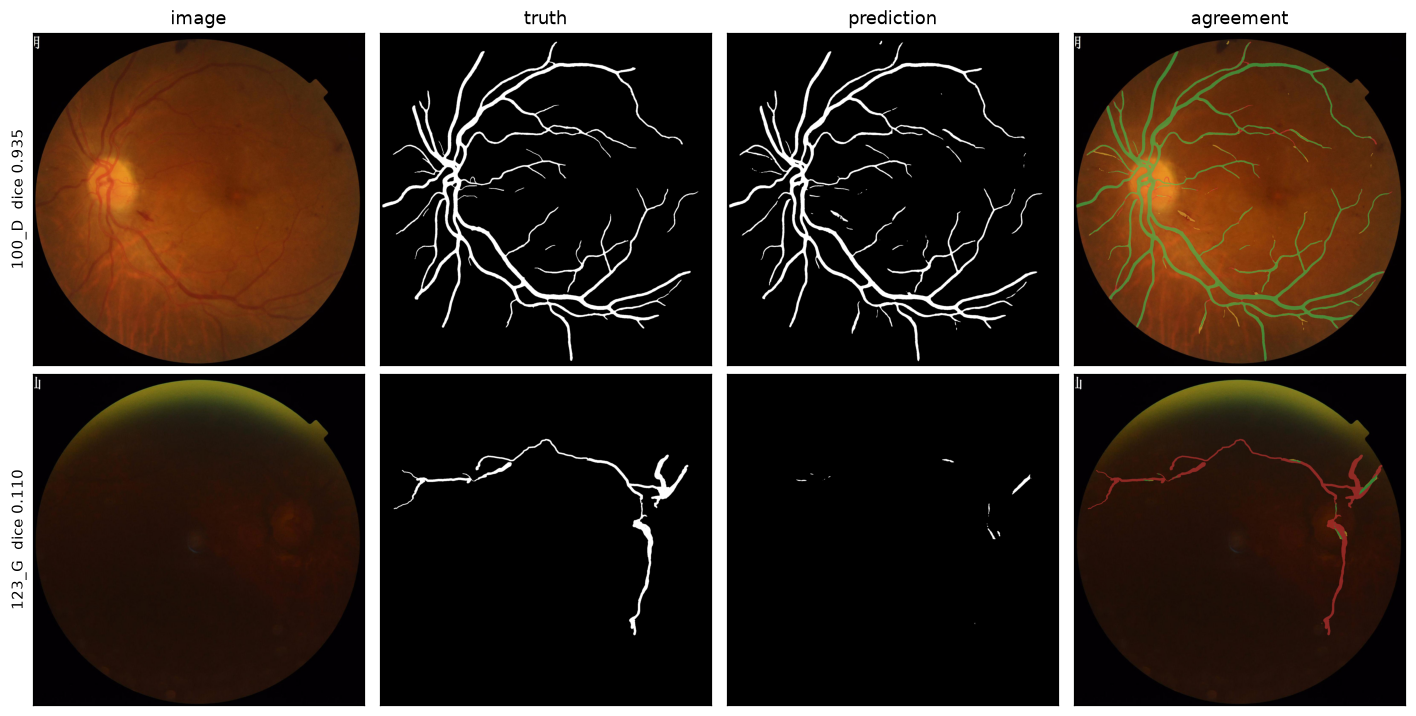
The top row is the first case in the split, 100_D at Dice 0.935. The bottom row is the worst case in the whole test set, 123_G at 0.110, and the photograph is nearly black - which is the quality finding above, arrived at from the other end. Look at the truth column rather than the prediction: the annotator traced four vessels out of a tree, because four is what is visible. The model found almost none of them.
Drawing it needs two images out of two hundred, and the whole split at 2048 x 2048 is about 6.7 GB, so the stream is read for the two it is asked for and the rest are dropped as they arrive:
wanted = {"100_D", "123_G"}
drawn = {
    case: whole
    for case, whole in engine.predict_stream("vessels", split="validation")
    if case in wanted
}
predict_stream() keeps one answer at a time; predict() would hand back all 200 at full resolution in order to draw two of them. It is cheap in memory and not in time - the stream is sequential, so two cases out of two hundred still run the model over two hundred.
Two of those choices, measured afterwards
loss: cce_dice and splits: [4, 4] are the two decisions in the configuration above that read as taste. Both have since been measured on this dataset - after this page’s walk was written, and with every arm kept rather than described - and one of the answers contradicts the section this page opens with.
The tables below are transcriptions. The runs live in the project’s workbench under measurements/fives/, and each table is printed by a script that reads the stored records back: losses-read.py, boundary-read.py and tiling-read.py. Nothing on this page runs them.
The setting is not this page’s, which is the first thing to know before comparing anything to the numbers above. Every arm trained on 148 of the 600 training retinas - every second one within each disease group, so the four stay balanced - for up to 40 epochs with early stopping on val_dice at patience 8, and every arm was scored case by case on the same 200 test images. So no absolute Dice below is comparable to the 0.8828 above; what the tables are for is the differences, each paired case against case.
A difference is read against a measured floor rather than against zero. The baseline ran twice with different seeds, and the floor is the larger of that pair’s mean difference and that mean’s own standard error: 0.0009 over all 200 cases and 0.0022 over the 67 that FIVES’s quality assessment flags. The x columns are multiples of that floor, and a row at 2x says nothing.
The loss is a decision, and this configuration already had the right one
All eleven of the engine’s semantic losses, at that setting:
| loss | dice | clDice - dice | vs cce_dice |
x | flagged | x | seeds |
|---|---|---|---|---|---|---|---|
focal |
0.8673 | +0.0078 | +0.0001 | 0.1 | +0.0020 | 0.9 | 1 |
cce |
0.8672 | +0.0084 | +0.0000 | 0.0 | -0.0028 | 1.3 | 1 |
cce_dice, the baseline |
0.8672 | +0.0052 | - | - | - | - | 2 |
combo |
0.8612 | +0.0048 | -0.0060 | 6.9 | -0.0021 | 1.0 | 1 |
lovasz |
0.8562 | +0.0041 | -0.0110 | 12.6 | -0.0192 | 8.7 | 2 |
generalized_dice |
0.8504 | +0.0082 | -0.0167 | 19.2 | -0.0229 | 10.4 | 1 |
boundary, surface 0.1 |
0.8491 | +0.0045 | -0.0181 | 20.8 | -0.0329 | 15.0 | 1 |
iou |
0.8309 | +0.0098 | -0.0362 | 41.5 | -0.0482 | 21.9 | 1 |
boundary, surface 0.3 |
0.8245 | -0.0051 | -0.0427 | 48.9 | -0.0581 | 26.5 | 2 |
tversky, alpha 0.7 |
0.8201 | +0.0134 | -0.0471 | 53.9 | -0.0638 | 29.1 | 1 |
dice |
0.8127 | +0.0154 | -0.0545 | 62.3 | -0.0648 | 29.5 | 1 |
focal_tversky, 0.7 and 1.33 |
0.7913 | +0.0188 | -0.0759 | 86.9 | -0.0940 | 42.8 | 1 |
The menu spans 0.0760 of Dice, 87 times the floor and 25 times the 0.0030 that separated the four architectures measured on nuclei. So the loss is a decision where the architecture was a menu - which is worth knowing before spending an afternoon choosing between u_net and linknet.
And nothing in the menu beats the default. focal at +0.0001 and cce at +0.0000 tie cce_dice, both below every floor measured anywhere here, and nine rows are worse. The family designed for thin structures under class imbalance - Tversky, Focal-Tversky, Lovasz - holds four of the five worst rows. cce_dice has been this example’s objective since it was written and nobody had measured whether that was right.
Two cautions the table carries about itself:
Nine of eleven rows have one seed. The four at the top move by less than the seed floors measured on any non-baseline loss here - 0.0120 for boundary at surface 0.3, 0.0465 for lovasz - so one seed cannot distinguish them from the baseline. Everything from boundary at surface 0.1 downwards is 10x to 87x the floor, and a second seed will not move it. lovasz is the warning worth reading twice: one of its seeds scores 0.8706, the highest single number in this table, and the other scores 0.8418.
The stopping rule is a confound, and it was priced rather than argued. Four arms stopped early enough that part of their deficit is convergence - focal_tversky at 20 epochs, lovasz’s second seed at 21, dice at 25, iou at 26 - while all three boundary arms ran into the 40-epoch cap. Re-read at 20 epochs, the budget every arm was granted, the ordering does not change.
The clDice - dice column also goes somewhere, and it was nobody’s question: it grows as the loss gets worse, from +0.0052 at the baseline through +0.0098 for iou and +0.0154 for dice to +0.0188 for focal_tversky. A worse objective loses more Dice than clDice, so what degrades first is the vessel’s bulk and its connectedness survives longer. There is exactly one exception, and it is the next table’s subject.
A surface loss is the one that breaks the lines, and it gets worse with the dose
boundary is the obvious thing to reach for on a nine-pixel structure: the boundary is the object, so an objective weighing the surface should be the one that helps. It does the opposite here, and it does so by a dose. alpha weights the region term, so the surface term’s share is 1 - alpha:
| surface share | seeds | flagged dice vs baseline | x | clDice - dice | its own pair, flagged |
|---|---|---|---|---|---|
| none, the baseline | 2 | - | - | +0.0052 | 0.0012 |
0.1, alpha: 0.9 |
1 | -0.0329 | 15.0 | +0.0045 | unmeasured |
0.3, alpha: 0.7 |
2 | -0.0581 | 26.5 | -0.0051 | 0.0120 |
Three times the surface term costs 1.77 times the Dice and 4.18 times the gap, and the gap changes sign: at surface 0.3 clDice falls below Dice, which no baseline run does. So the argument for this loss was backwards - connectedness is what it costs first, and on the flagged photographs it costs 15 to 27 times the noise.
Two things keep that honest. The dose has its own noise and it is ten times the baseline’s, which is the last column: the two arms at surface 0.3 sit 0.0120 apart on the flagged cases where the baseline’s two sit 0.0012 apart. (That column is each pair’s own mean difference; the x column’s denominator is still the baseline’s 0.0022 from above, so the two are not the same quantity and the table would mislead if they were read as one.) That is this loss’s documented behaviour - it grows noisier the more of the objective the surface term owns - reproduced on real data, and it is also the denominator the dose claim has to clear. Judged against it the two doses are 2.1x apart, not the twentyfold the baseline’s floor would suggest. And both arms at the higher dose stopped on the epoch cap with their best at the last epoch, so part of their deficit is being undertrained rather than being worse.
Tiling against resizing, where this page’s first section is too strong
Same data, same model, same loss. One arm tiles 2048 into 4 x 4 as the configuration above does; two resize the whole retina to 512 and leave splits unset. All three are scored on the source grid, 2048 x 2048, which for the resized arms means a second scoring pass.
| arm | dice | vs tiled | x | clean, 133 | flagged, 67 | clDice - dice | training |
|---|---|---|---|---|---|---|---|
| tiled, 4 x 4 at 2048 | 0.8672 | - | - | 0.9079 | 0.7865 | +0.0052 | 418 min |
| resized to 512, same cap | 0.8667 | -0.0005 | 0.6 | 0.8935 | 0.8134 | +0.0138 | 26 min |
| resized to 512, matched steps | 0.8705 | +0.0033 | 3.8 | 0.8984 | 0.8152 | +0.0141 | 165 min |
There are two resized arms because sixteen tiles make “the same number of epochs” the wrong comparison: 148 retinas at batch_size: 4 are 37 gradient steps an epoch resized and 592 tiled. The first resized arm is the comparison somebody would actually run - the same 40-epoch cap and the same patience. The second was granted the tiled arm’s 23,680 steps and did not spend them, stopping on patience at 41% of the budget, so that row is converged against converged. The truncation the first arm suffered is worth +0.0038, which is worth knowing before budgeting for the matched arm: a measurement that cannot afford it loses 0.004 and the ability to say so.
The overall column says the two methods are equivalent, and it is hiding the largest effect in the measurement. Resizing is better by 0.027 to 0.029 on the 67 flagged photographs and worse by 0.010 to 0.014 on the 133 clean ones, both many times their own floors - 0.0019 to 0.0025 flagged, 0.0007 to 0.0013 clean. The two are good at different pictures, and a swing of about 0.03 in each direction averages out to 0.0033.
So what survives from “Why a vessel cannot be resized” is the narrow claim: on a clean photograph resizing costs Dice, and splits is what lets an image too large to resize be trained at all. What does not survive is the stronger reading - that resizing a 2048 retina destroys the thin vessels - because on the hard pictures the vessels it was supposed to have destroyed are found more reliably from a whole blurred eye than from a sixteenth of one. A mechanism suggests itself and is recorded as a hypothesis rather than a finding: a 512 tile sees one sixteenth of a retina and has no global context to tell a vessel from an artefact, where a resized image always shows the whole eye. Separating that would need overlapping tiles or a resized arm at 1024, and neither was run.
What tiling costs is also not what the table makes it look like. Per gradient step the three arms are identical to within the noise of six readings, 0.502 to 0.554 s, so tiling is sixteen times the work rather than sixteen times the overhead, and the whole factor shows up in the epoch rather than anywhere surprising.
The rig, which is worth more than the ranking
This is the part to carry away from all three tables, and it is about measuring rather than about retinas.
evaluate_cases() builds its dataset from the model’s own specification, so it scores each model at that model’s own load_shape. Put a tiled model beside a resized one and the first is scored on 2048 while the second is scored on 512, against a truth reduced the same way. Nobody passes a flag for this and nothing warns:
| arm | honest, both on 2048 | as the default comparison reports it | the rig |
|---|---|---|---|
| resized to 512, same cap | -0.0005 | +0.0056 | +0.0062 |
| resized to 512, matched steps | +0.0033 | +0.0187 | +0.0154 |
The reported figure is 5.7 times the honest one and the rig alone is 4.7 times the effect. A table built that way would have concluded that resizing beats native-resolution tiling by a wide margin, and every number in it would have been a real Dice of a real prediction against a real mask - just not the mask the other arm was judged against.
And the bias has the opposite sign on clDice: +0.0096 to +0.0156 on Dice against -0.0156 to -0.0230 on clDice. Upsampling a 512 prediction to 2048 smooths it, and a smoothed vessel agrees better with a skeleton and worse with a boundary. So the rigged comparison flatters resizing on Dice and penalises it on clDice, and a comparison reporting only one of the two is wrong in a direction set by which one it picked.
There is no option for this in either package today. The arms above were rescored onto one grid by a function written for that measurement, which lives in the workbench and not in the package, so the honest comparison is currently available only to somebody who has already noticed the problem. maju116/rplatypus#187 is the issue for it. Until it is answered the rule is the one this section is: compare two models only where their predictions and the truth are on the same grid, and say which grid that is.
What none of this says
One dataset, one architecture, one loss, at one reduction of one resolution, with 148 retinas rather than 600. The subsets already disagree by about 0.03 in either direction inside this dataset, which is the strongest available warning against reading any overall column as a rule. And the published fives-unet weights’ own score is not comparable to any row above either - different data, a full training set, and a pinned commit.
Notes
The data’s licence travels. FIVES is CC BY 4.0, which is why the published fives-unet weights are CC BY 4.0 rather than MIT and why their sidecar carries the citation: Jin et al., FIVES: A Fundus Image Dataset for Artificial Intelligence based Vessel Segmentation, Scientific Data 9, 475 (2022).
The cost. 40 epochs over 600 retinas at 2048, cut sixteen ways, is 403 minutes on a GTX 1070; scoring the 200 test images, including reassembling each one for clDice, is about two minutes. Tiling is what makes the first number bearable rather than worse: a tiled run reuses each decoded image for all sixteen of its tiles, which is worth roughly a factor of two against decoding one per tile.
A card that uses the GPU it has. A Pascal-generation card needs the last PyTorch built against CUDA 12; the R package has platypus_use_torch("pascal") for that because it builds its own environment, and here it is an ordinary install of a matching wheel.